 |
The NBOView program creates graphical 1D/2D/3D images of electronic orbitals produced by the Natural Bond Orbital (NBO) program. You first include the PLOT keyword as an option in the input $NBO keylist of your NBO job (say for ETHANE, C2H6),
$NBO PLOT FILE=ETHANE $END
The NBO program produces a series of "plot files" (say, ETHANE.31, ETHANE.32, ..., ETHANE.46) that can be read by NBOView to produce graphical localized and delocalized orbital images for the chosen molecule.
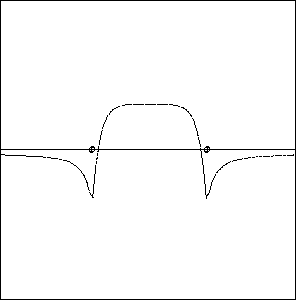
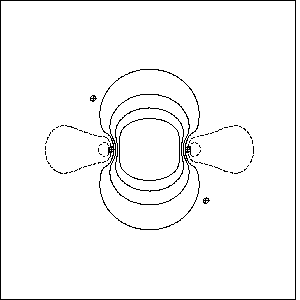
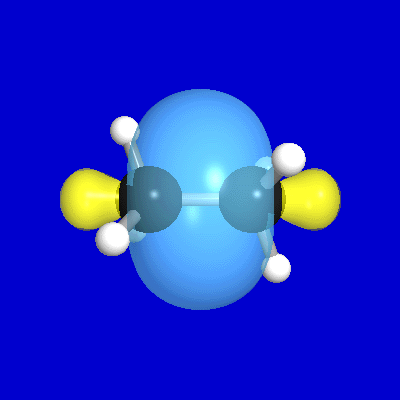
NBOView can provide a variety of 1-, 2-, and 3-dimensional graphical images of electronic orbitals (or total electron density) in individual or composite forms, using a variety of file formats suitable for viewing or printing:
 |
 |
 |
NBOView performs all functions of the earlier
ORBPLOT
program, with numerous extensions
and improvements.
NBOView can accept input plot files from a variety
of installed NBO configurations, including those embedded
in host
electronic structure system (ESS) packages
or
GENNBO 6.0W
or other stand-alone versions. NBOView
versions are available for a variety of environments from
the technical workstation or mainframe to the PC desktop, and
can accept input plot files from either current NBO 6.0 or
earlier (post NBO3-level) versions, up to angular orbitals of f-type.
The NBOView program runs on a variety of platforms, all presenting a consistent interface to the user (as described in following sections). However, the specific hardware and software requirements depend on the selected platform:
For MS-Windows systems, insert the NBOView distribution disk in the CD reader and follow the prompts. After installation is complete, double-click the NBOView desktop icon to run the program.
For other systems, copy the contents of the NBOView distribution disk to a chosen directory, build the executable code from supplied Fortran (.f) and C (.c) source files (if necessary), and run the program by standard OS commands.
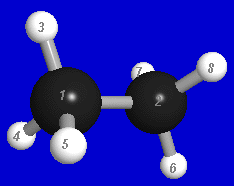
Prior to running NBOView, you must generate the required PLOT files from an installed NBO program and copy these files into the default directory (folder) or other accessible directory of your system. We shall suppose that the PLOT files ETHANE.31, ETHANE.32, ... for the ethane molecule (C2H6) were created with the z-matrix coordinates
  C     0.000000    0.000000    0.770000
  C     0.000000    0.000000   -0.770000
  H     0.000000    1.027662    1.133333
  H    -0.889981   -0.513831    1.133333
  H     0.889981   -0.513831    1.133333
  H     0.000000   -1.027662   -1.133333
  H    -0.889981    0.513831   -1.133333
  H     0.889981    0.513831   -1.133333
leading to the geometry and atom numbering shown below:
 |
Note that all orbital numbering and basis labels used by NBOView conform to those of the NBO output.
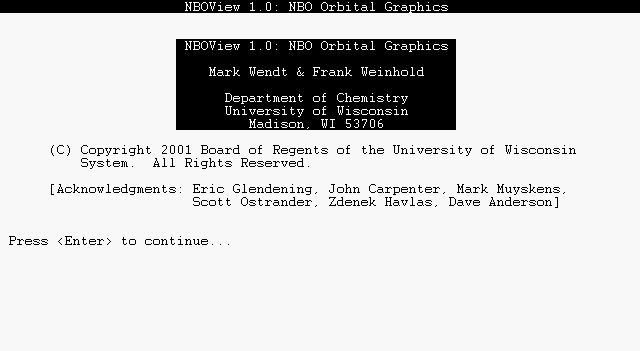
Launch the NBOView program (e.g., by double-clicking on the desktop icon) to see the program title page as displayed below:
 |
Press the ENTER (carriage return) key to continue to the PLOT input page. NBOView first asks for the stem-name of the molecule PLOT files; type "ETHANE". You should see a list of basis sets and the associated filenames found in the directory, as shown below:
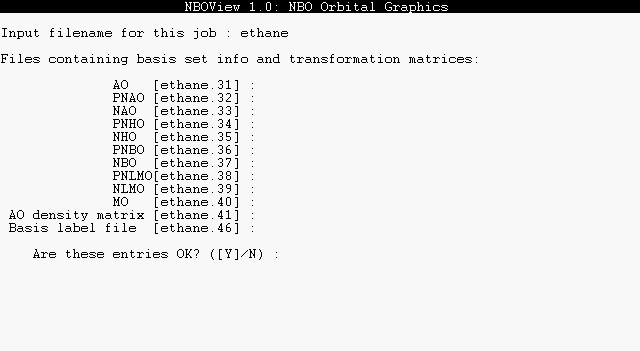 |
In response to "Are these entries OK?", press the ENTER key to accept the default "Y" (yes) response. Throughout the program, you can simply press ENTER to accept any displayed [default] value enclosed in brackets. By responding "N" (or "n", "No", etc.), you can also enter a new basis filename, if you have altered a default NBO filename, or type "N" if a basis file is unavailable. Note that the AO basis info .31 file must be available, as well as the file for any basis set selected with the BASIS command.
After this initial program setup, the main NBOView command page and "Command:" prompt appears:
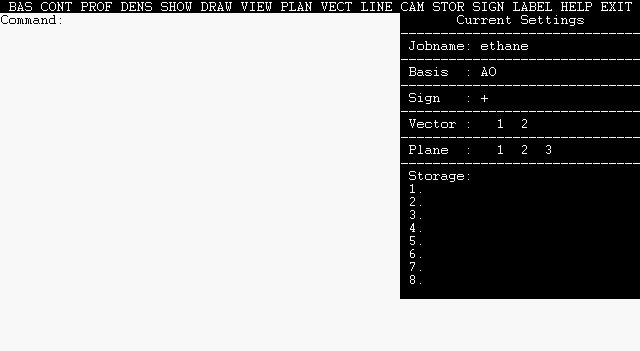 |
The list along the top of the page gives valid commands that may be entered, as a full name or unique abbreviation. For example, type "BASIS PNBO" to select the pre-orthogonal PNBO basis set and "CONTOUR 1" to draw contours of PNBO 1 on the terminal screen. Continue pressing ENTER to accept the default parameters until the orbital image appears on the screen, as shown below:
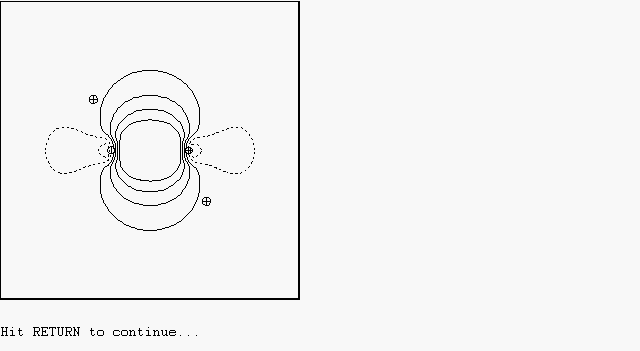 |
The orbital image is also saved in location 1 of the eight available storage locations, as shown by the "[C 1] PNBO C1-C2" entry in the status bar at the right edge of the screen. The status bar summarizes the current contents of the eight storage locations s1, s2, ..., s8, as well as the current BASIS, SIGN, VECTOR axis, and contour PLANE settings.
Now type "CONTOUR 26" to similarly display PNBO 26, which will be stored in location 2 ("[C 26] PNBO C1-H3*"). Then type "SHOW 1 2" to show an overlay of the plots stored in locations 1, 2 (i.e., an overlay of PNBOs 1 and 26, the C1-C2 bond and C1-H3* antibond). You can similarly type "PROFILE 26" to see a comparison 1D plot of the C1-H3* antibond amplitude. Type "EXIT" when you wish to end the session.
These examples briefly illustrate the command-line interaction with the program. More complete specifications of available commands, syntax, and status bar entries will now be given.
The full list of NBOView commands, unique abbreviations, command arguments (if any), and requested action is summarized in the table below:
| Command | Argument(s) | Action |
| BAsis | type | Selects the current basis set. For example, "BASIS PNBO" selects the pre-NBO basis. For open-shell systems, the command "BASIS a" (alpha) or "BASIS b" (beta) selects a particular spin set of the current basis. |
| COntour | i | Displays 2D contours for selected orbital i of the current basis set in the current contour plane (see PLANE) on the terminal screen. For example, "CONTOUR 24" displays contours of orbital 24. |
| PRofile | i | Displays a 1D orbital amplitude profile for a selected orbital i of the current basis set along the current vector axis (see VECTOR) on the terminal screen. For example, "PROFILE 24" displays the amplitude profile of orbital 24. |
| DEnsity | Displays contours of total electron density in the current contour plane (see PLANE) on the terminal screen. The current basis set must be orthonormal. | |
| SHow | s1, s2,... | Displays the contents of current storage locations s1, s2, ... on the terminal screen. For example, "SHOW 2,4" displays the current contents of storage locations 2 and 4 in an overlaid image on the terminal screen. |
| DRaw | s1, s2,... | Similar to SHOW, but creates a file suitable for printing on a laser printer. You will be prompted for the desired format: PostScript (.ps), graphics bitmap (.bmp), HP LaserJet bitmap (.hpb) , or TechSet bitmap (.tsb). For example, "DRAW 2,4" prepares an overlaid image of storage locations 2 and 4 for hardcopy output. |
| VIew | s1, s2,... | Creates a 3D rendered photo-like view of the orbital objects in storage locations s1, s2, ... and stores it in a bitmap (.bmp) file of chosen name, size, and resolution. For example, "VIEW 2,4" prepares a rendered .bmp file showing 3D images of the orbitals in storage locations 2 and 4. |
| PLane | Allows user to specify the contour plane for CONTOUR and DENSITY plots. Full details of requested input are described below. The default contour plane contains the first three atoms of the molecule, with the origin (screen center) midway between the first two atoms. | |
| VEctor | Allows user to specify the vector axis for PROFILE plots. Full details of requested input are described below. The default profile axis passes through the first two atoms of the molecule, with the origin (screen center) midway between these atoms. | |
| LIne | Allows user to specify the number and types of the contour lines (outermost contour, contour interval, maximum number of contours) as well as details (length, spacing) of the dashed lines for contours of negative phase. Initial defaults are provided for all parameters. The default outermost contour (0.0316 a.u.) corresponds roughly to the empirical van der Waals radius [see Bader and coworkers, J. Chem. Phys. 46, 3341 (1967)]. | |
| CAmera | Allows user to specify details of the camera and lighting model for fully rendered 3D images, including many details of viewing angle and light sources as well as color, translucency, and surface reflectivity of orbitals, atoms, and bonds. Full details of requested input parameters are described below, with recommended defaults provided for all parameters. | |
| STorage | Summarizes the current contents of the eight storage locations in a more complete form than the abbreviated status bar listing. | |
| SIgn | Reverses the overall sign (phase) of orbitals, interchanging positive (blue) and negative (yellow) lobes of subsequent CONTOUR or PROFILE plots. The SIGN command toggles between the two possible overall signs (+ or -), as shown in the status bar. | |
| LAbel | Displays a list of orbital labels for the current basis set. The numbers and labels correspond to those used in NBO output. | |
| Help | command | Provides a brief on-screen summary of command syntax, parameters, abbreviation, and function for each command. For example, the command "HELP DRAW" displays help for the DRAW command. |
| Exit | Normal exit from the program. |
Multiple arguments may be separated by commas or spaces. In general, all input is case-insensitive and commands may be abbreviated by their leading unique characters. Thus, the command "DRAW 1,2" could be entered as "draw 1 2", "dr 1 2", etc. Further details of the dialog associated with individual commands are given in following sections.
Before computing a 2D contour diagram, a contour plane must be specified. This plane can be defined to pass through three atoms of the molecule, or may be rotated by a chosen angle about either bond axis connecting these atoms. Full specification of the viewing plane also includes specifiying its center (the origin of a cartesian X,Y axis system that describes any position in the plane) and the outermost limits in the X and Y directions. Dialog to define the plane is initiated whenever you give the PLANE command, or upon first use of a CONTOUR or DENSITY command.
The dialog to define a contour plane is illustrated below:
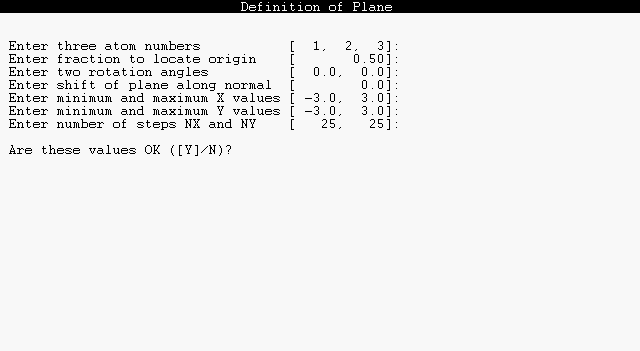 |
The bracketed default values may be accepted by pressing the ENTER key at every prompt. Otherwise, you may type in altered values, as shown for the first prompt. Entries may be separated by commas or spaces.
The following algorithm is used to determine the plane from the prompted input:
This completes the selection of a plane. The X (horizontal) axis coincides with AXIS 1 and the Y (vertical) axis with AXIS 2. Note that by suitable choices of these seven input parameters you can specify amy possible choice of the contour plane. Usually the plane will be chosen to pass through three atoms, and in this case the final three parameters (two rotation angles and a normal shift, with default values 0.0) can be ignored. However, by setting either of the rotation angles to 90 degrees, one can view contours in the plane of pi-bonding with respect to each pair of atoms. Similarly, by setting a non-zero normal shift one can select cross-sections through a pi-bond above or below the nodal plane. Thus, the input parameters are usually convenient to orient the contour plane with respect to any desired chemical features.
The three remaining dialog prompts are used to select a viewing window and density of grid points on this plane. The maximum and minimum X, Y values are in angstroms. A 25 x 25 grid is generally sufficient for contour diagrams of first-row compounds, but enhanced resolution (say, 50 x 50) may be necessary when the image has ornate nodal features.
The dialog to select a vector axis for orbital profile diagrams is similar. This dialog is initiated whenever you give the VECTOR command, or upon first use of a PROFILE command:
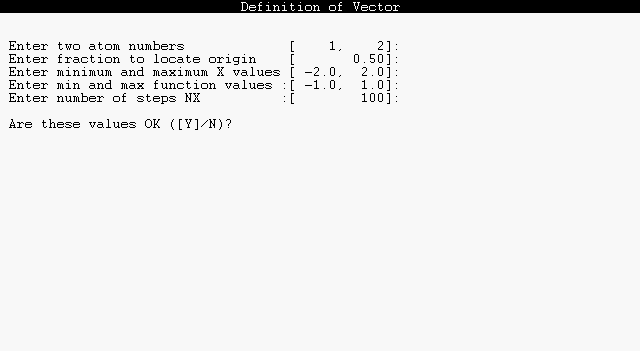 |
The vector coincides with the line of nuclear centers between the two atoms specified, directed from the first toward the second. The fraction 0.0 places the origin on the first atom and 1.0 on the second atom, with other values shifting the origin accordingly. Note that the maximum and minimum X values (distance along a bond axis) are in angstrom units, but the maximum and minimum Y values (orbital amplitude) are in atomic units.
NBOView stores up to eight graphical images in memory. Each time a PROFILE, CONTOUR, or DENSITY command is given, the computed image is stored, the first image in location 1, the second in location 2, and so on. When all eight memory locations are filled, NBOView begins writing new images over old ones, so that the ninth image in written to location 1, the tenth to location 2, and so on. The most recent entry is marked with an asterisk (*) in the "current settings" status bar area at the right edge of the screen.
The user can also monitor the contents of memory locations with the STORAGE command. The following is sample output showing the current contents of each location:
     -------------------------------------------------
                     Current Storage

      Location     Type     Orbital     Space    Phase
     ----------  --------  ---------  ---------  -----
         1       Contour   AO    12   Plane   1    +
         2       Contour   PNLM   5   Plane   2    +
         3       Contour   PNLM   5   Plane   2    -
         4       Profile   NAO   14   Vector  1    +
         5       Charge               Plane   2
     ->  6       Contour   PNBO  23   Plane   2    +
     -------------------------------------------------
This summary gives additional detail on what basis set, phase, and contour plane or vector axis were selected at the time each image was stored. Note that the pointer (->) marks the memory location of the most recent stored image.
Like SHOW or VIEW, the DRAW command refers to images that have already been created and stored with CONTOUR or PROFILE commands:
DRAW s1, s2, ...
The DRAW command leads to dialog for desired output options as shown below for default Postscript output:
 |
Accept the displayed [default] options by pressing the ENTER key at each prompt, or select alternatives of your choice. The default Postscript (.ps) option employs vector graphics instructions that are easily re-scaled to any desired plotsize, whereas the remaining options produce 300 dpi bitmap files that are best printed at the selected size. The HP-PCL (.hp) bitmap is of native PCL (printer control language) form that can be printed directly on any HP LaserJet-compatible laser printer. The TechSet (.tsb) bitmap can be printed with the TechSet system. The graphics image bitmap (.bmp) can be displayed or printed with many browsers or screen utilities.
One or more orbitals that have previously been displayed and stored in memory with a PROFILE or CONTOUR command can be converted to fully rendered form as a 3-dimensional photograph-like bitmap (.bmp) image. The syntax for conversion to a 3-dimensional VIEW is similar to that for SHOW or DRAW commands, viz.,
VIEW s1, s2, ...
where s1, s2, ... are valid storage locations (1-8) containing the orbitals to be rendered. Like the DRAW command, VIEW produces a .bmp (bitmap) file for external usage, rather than for display within NBOView itself. You can produce any number of VIEW bitmap files within a single NBOView session.
If this is your first VIEW command, you will be prompted for the input associated with the CAMERA command, which determines details of orbital optical properties, camera placement, lighting, and the like. A full description of the input dialog is given below. Initially, you can simply accept the default parameters by pressing the ENTER key in response to each prompt.
Following the CAMERA dialog, you will be prompted for lobe detail, image size, resolution, and bitmap filename as shown below:
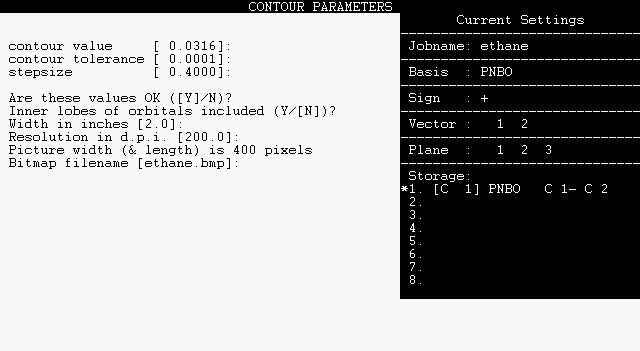 |
Alter the default values as desired. The default image size is 2 x 2 inches with 200 dot-per-inch resolution, adequate for ordinary screen display or printing. Note that NBOView employs an analytical algorithm (rather than surface triangulation) to give highest possible visual quality. Because the rendering time increases quadratically with image dimension or pixel resolution, long computer runs may be incurred if you select larger images or higher resolution.
The final .bmp file can be viewed with a graphical browser or screen utility (such as PAINT) after you exit the NBOView program. The .bmp file can also be converted to .gif or other file formats for web display or other specialized graphical needs.
The CAMERA command initiates dialog to control the
virtual "camera" and "lighting model" of the 3-dimensional
photograph-like image produced by the VIEW command. The
camera/lighting model is controlled by about 50 numerical parameters,
arranged into five groups:
(1) Camera and light-source parameters
(2) Surface optical parameters
(3) Color parameters
(4) Atomic and bond radii
(5) Contour parameters
Default values can be accepted for each group by pressing
the ENTER key, or the values within a group can be
altered individually.
The dialog and default parameter values for each group are listed below, with brief discussion of the parameters in each case:
     camera distance from screen center  [           6.43]:
     two rotation angles (about X, Y)    [    0.0,    0.0]:
     camera view angle                   [           50.0]:
     lighting (RL, UD, BF w.r.t. camera) [ 2.0, 2.0,  0.0]:
                 amb  diff  spec  pow  transp

     atoms    [ 0.60,  1.0,  1.0, 40.0,  0.0]:
     bonds    [ 0.60,  1.0,  1.0, 40.0,  0.0]:
     H-bonds  [ 0.60,  1.0,  1.0, 40.0,  0.0]:
     orbitals [ 0.60,  1.0,  1.0, 40.0,  0.0]:
                               blue  green  red

     light source color      [  1.0,  1.0,  1.0]:
     background color        [ 0.80,  0.0,  0.0]:
       [For clear background, use (1,1,1)]
     orbital (+ phase) color [  1.0, 0.80, 0.40]:
     orbital (- phase) color [  0.0,  1.0,  1.0]:
     bond color              [ 0.50, 0.50, 0.50]:
     H-bond color            [  0.0, 0.70,  1.0]:
| H | He | ||||||||||||||||
| Li | Be | B | C | N | O | F | Ne | ||||||||||
| Na | Mg | Al | Si | P | S | Cl | Ar | ||||||||||
| K | Ca | Sc | Ti | V | Cr | Mn | Fe | Co | Ni | Cu | Zn | Ga | Ge | As | Se | Br | Kr |
| Rb | Sr | Y | Zr | Nb | Mo | Tc | Ru | Rh | Pd | Ag | Cd | In | Sn | Sb | Te | I | Xe |
| Cs | Ba | La | Hf | Ta | W | Re | Os | Ir | Pt | Au | Hg | Tl | Pb | Bi | Po | At | Rn |
| Fr | Ra | Ac | |||||||||||||||
| Ce | Pr | Nd | Pm | Sm | Eu | Gd | Tb | Dy | Ho | Er | Tm | Yb | Lu | ||||
| Th | Pa | U | Np | Pu | Am | Cm | Bk | Cf | Es | Fm | Md | No | Lr |
     atomic radius for H      [ 0.22]:
     atomic radius for C      [ 0.50]:
     bond radius              [ 0.10]:
     H-bond radius            [ 0.05]:
     contour value     [ 0.0316]:
     contour tolerance [ 0.0001]:
     stepsize          [ 0.4000]:
Each time you select new parameters under a BASIS, VECTOR, PLANE, or CAMERA command, your choices can be recorded in a special NBOVIEW.DEF options file to replace standard NBOView default values when you next enter the program. This allows you to recall or customize NBOView program settings for a particular application or general personal preference.
To record your current options for possible use in a future session, answer the EXIT question
Save current settings to NBOVIEW.DEF file (Y/[N])?
in the affirmative by typing "Y" (or "y"). If this file exists on the NBOView directory, you will be asked whether you wish to use it the next time you enter the program:
Use program settings in NBOVIEW.DEF file (Y/[N])?
Declining the invitation (or removing the NBOVIEW.DEF file from the directory) re-establishes the default NBOView program settings.
For users with source code versions (only), it is possible to use NBOView in an automated batch mode, rather than interactively. In this case, the program is controlled by a special nboview.inp "script" file, prepared in advance, that serves in place of user keystrokes as the input to the program. This may be useful in automating long, repetitive tasks (such as preparing successive frames of a movie) that would be tedious for a human interactive user.
To use this option, you must set the IWBATCH ("I want batch") parameter to 1 by inserting a "C" as the first column of line 57 and deleting the "C" as the first column of line 58 of the nboview.f source program file, as shown below:
C      DATA IWBATCH/0/   !terminal mode
      DATA IWBATCH/1/   !batch mode (driven by NBOVIEW.INP)
Then rebuild the NBOView executable, just as you did at first installation. Next, prepare the nboview.inp file whose lines contain the input commands you would have typed at the keyboard. (For this file to work correctly, you must accurately visualize the sequence of prompts that the program gives to an actual interactive user typing the same commands.) Finally, submit the job to your system as a batch application, using standard OS commands.